The rise of Bluesky marks a significant shift in the social media landscape — away from centralized control and toward open, federated protocols. Powered by the AT Protocol, Bluesky enables users to move freely across apps, manage their algorithmic feeds, and engage in a more transparent and customizable online environment.
Since its public launch in early 2024, Bluesky has attracted millions of users, particularly in moments of turbulence on other platforms like X (formerly Twitter). As of mid-2025, the platform boasts over 36 million accounts, and researchers are beginning to take note of its potential as a new field for social media network analysis.
Bluesky presents a unique opportunity for researchers thanks to its open APIs and transparent architecture. It’s a rare chance to observe a social network from its formative phase. The customizable feeds offer users more agency, but this very freedom can also reinforce ideological clustering. As people choose what they want to see, they may inadvertently isolate themselves from dissenting views. Combined with the recent drop in posting activity, this highlights the tension between openness and cohesion in digital communities.
Why analyze Bluesky?
Unlike traditional platforms that limit access to their data or impose opaque algorithmic structures, Bluesky offers:
- A federated social graph that spans across different apps (e.g., Flashes, Spark)
- Open APIs and transparent data flows
- A relatively young network, ideal for longitudinal observation
- A growing and diversified user base, from journalists and tech enthusiasts to activists and artists
Introducing Nodiux: a practical tool for network exploration
Nodiux is designed to make Bluesky data exploration fast, accessible, and insightful — even for those with limited technical skills. From a simple interface, it lets you search, visualize, and download structured representations of conversations and content flows.
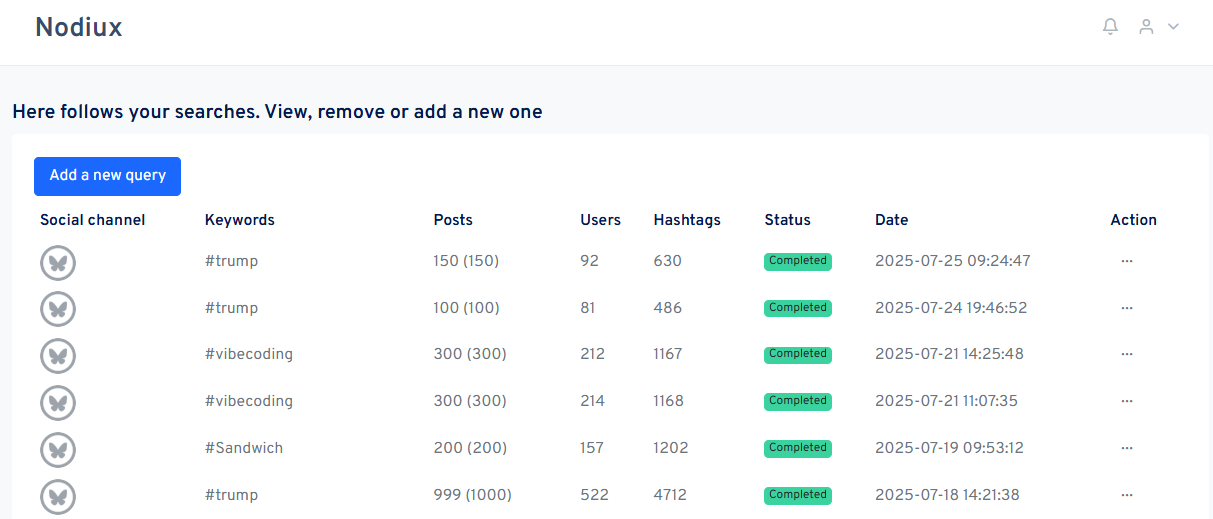
How it works
The workflow begins with a simple search based on a hashtag or a username. This triggers the collection of public posts that match the query, typically over the past few days or weeks (depending on availability via the API).
Once a search is completed, it appears in the dashboard — your personal hub where you can revisit or explore the results in detail.
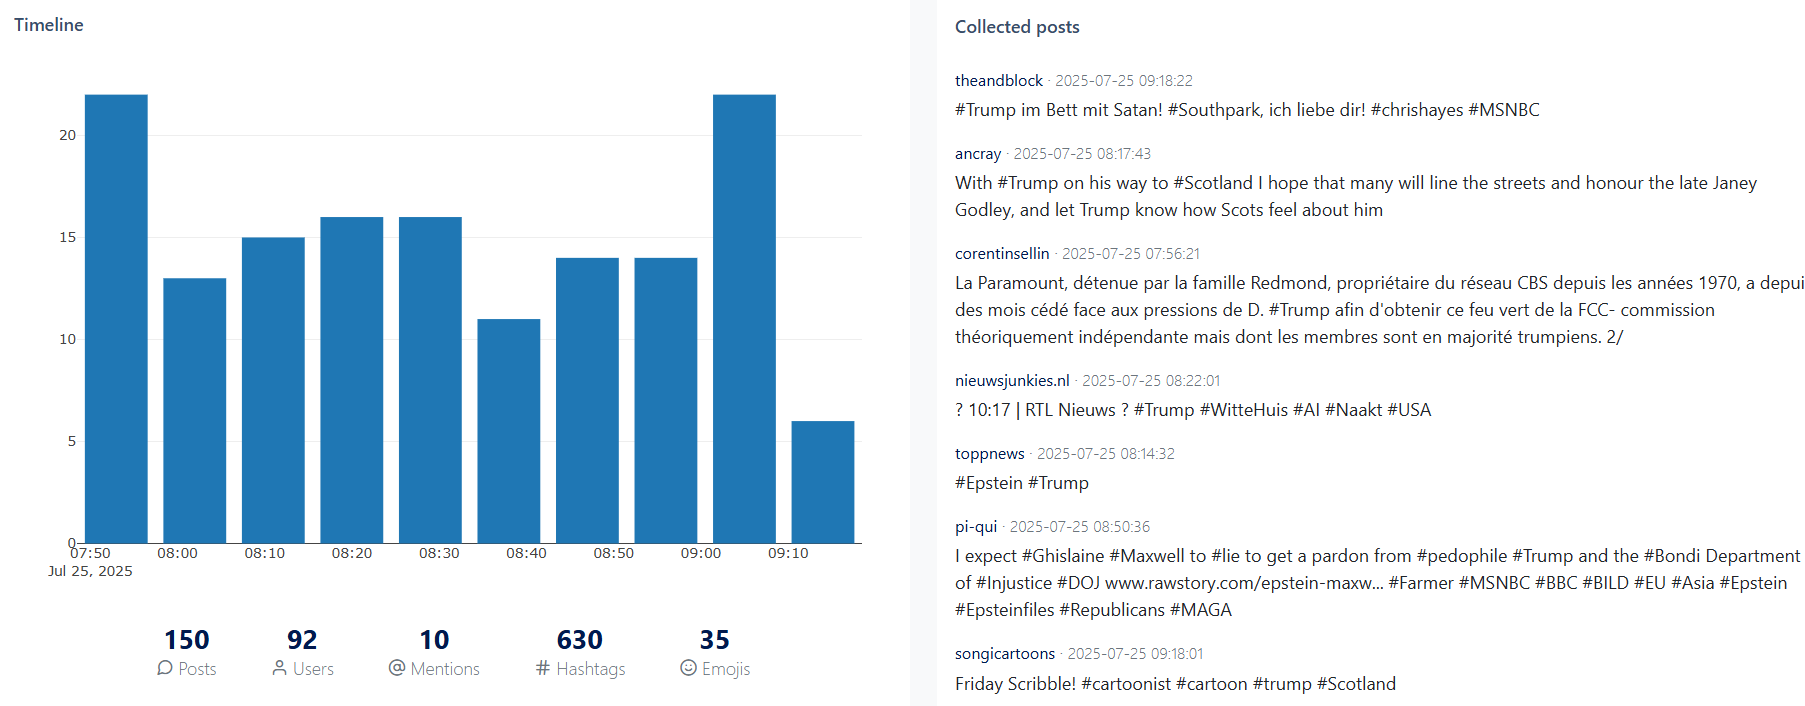
Post timeline and detail
By clicking on a completed search, you can access a set of detailed statistics. First, a time series chart displays the volume of posts over time for your search term, along with a list of the individual posts—both available for download in CSV and XLSX formats.
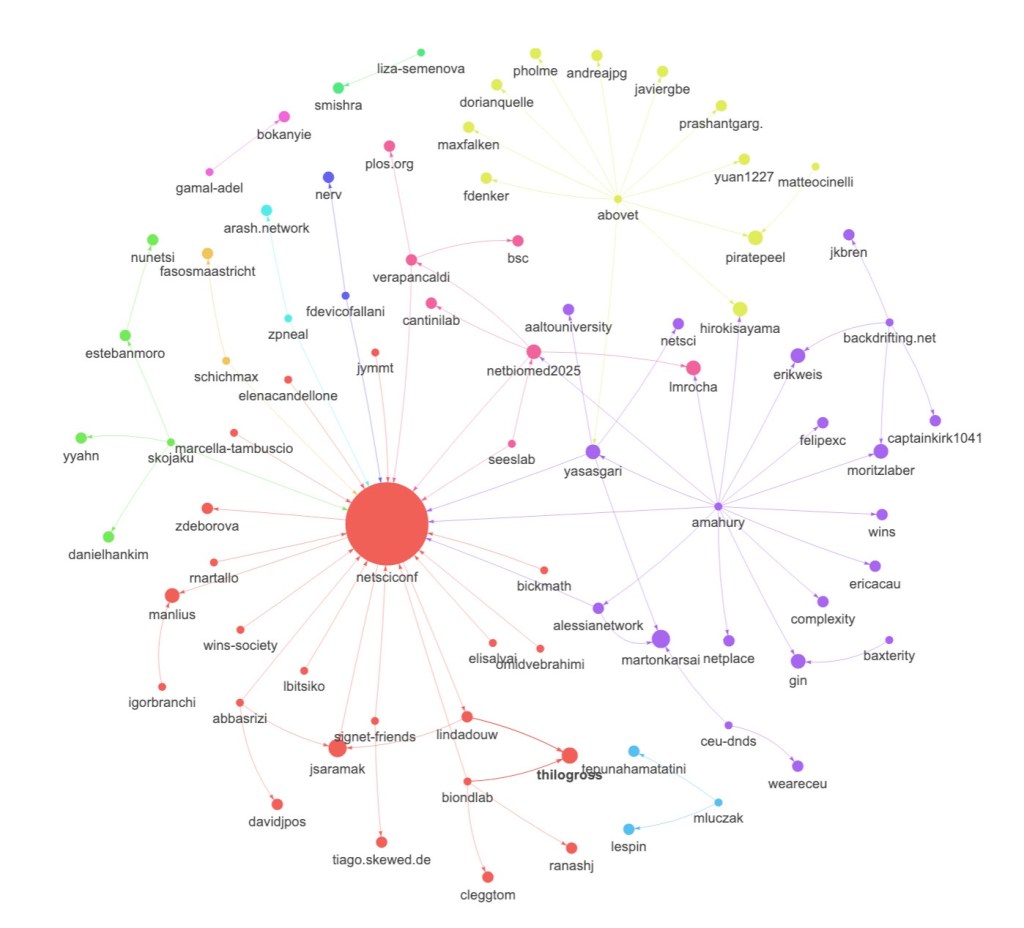
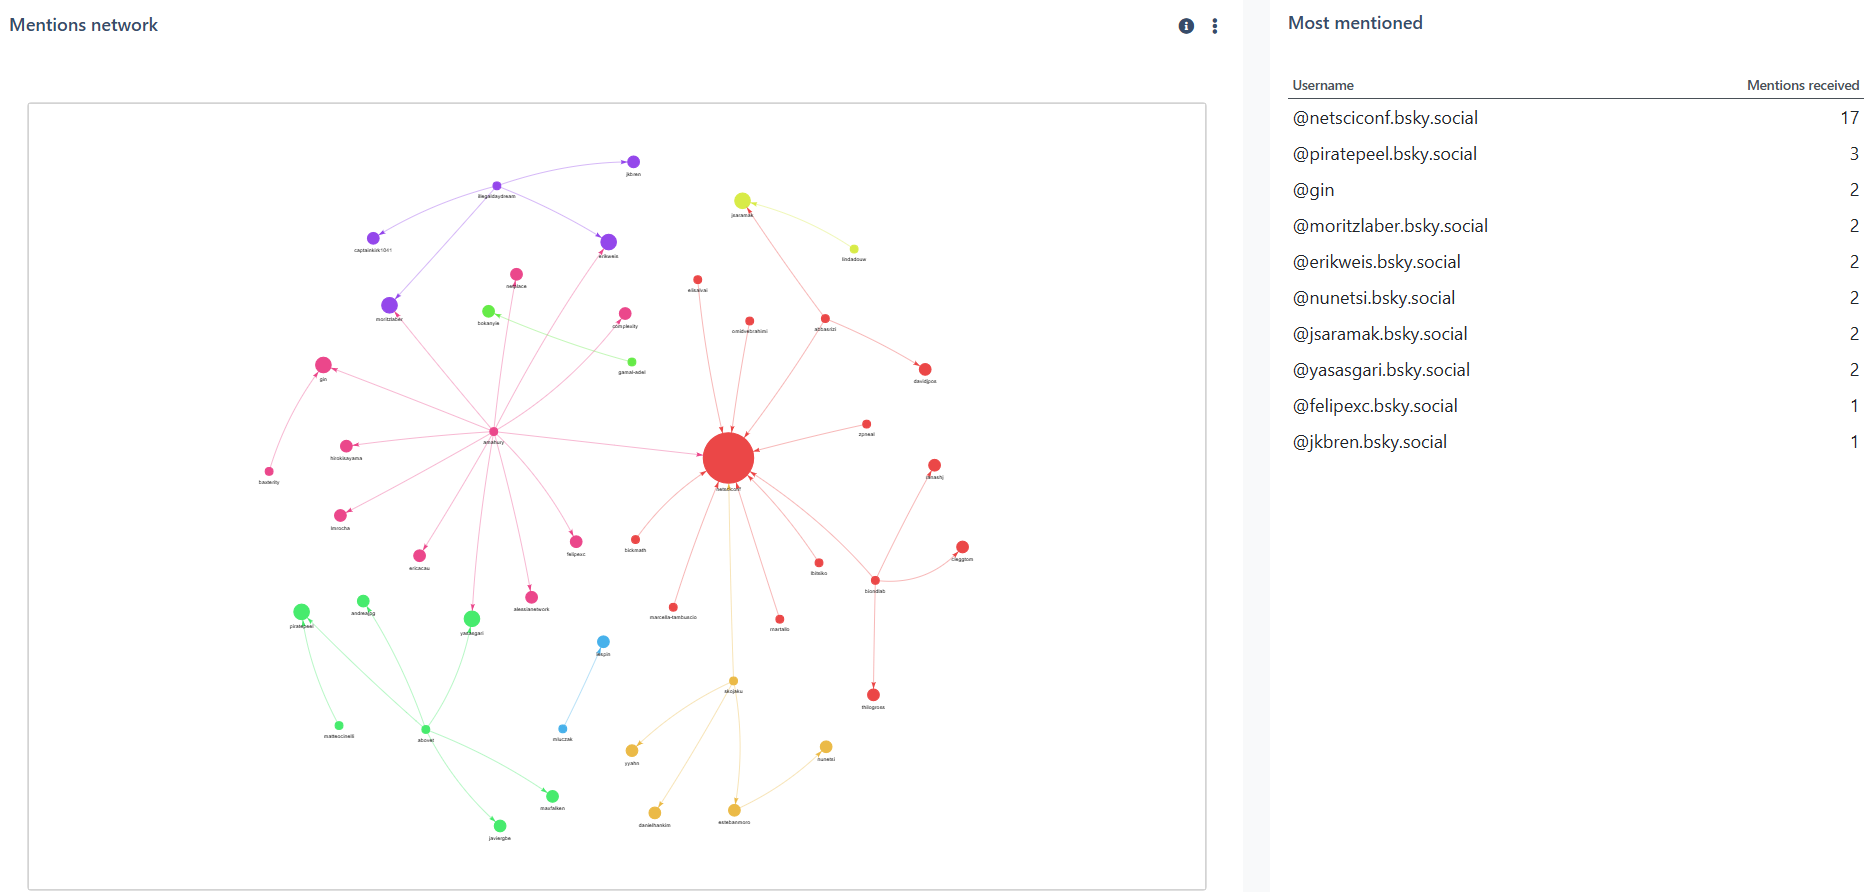
Mentions network
This is one of Nodiux’s core visualizations: a directed graph where nodes represent users, and edges represent mentions (i.e., user A mentioned user B in a post).https://nodiux.net
Key characteristics:
- Node size reflects the number of mentions received (in-degree)
- Edge thickness reflects the frequency of interactions
- Different colors are used to indicate distinct subcommunities within the graph
- The graph can be explored visually, or downloaded in two formats:
- GEXF for advanced visualization in Gephi
- CSV edge list for further processing
- Accompanied by a Top 10 leaderboard of the most mentioned users in the dataset
This network helps identify influencers, conversation hubs, and bridges within the discourse.
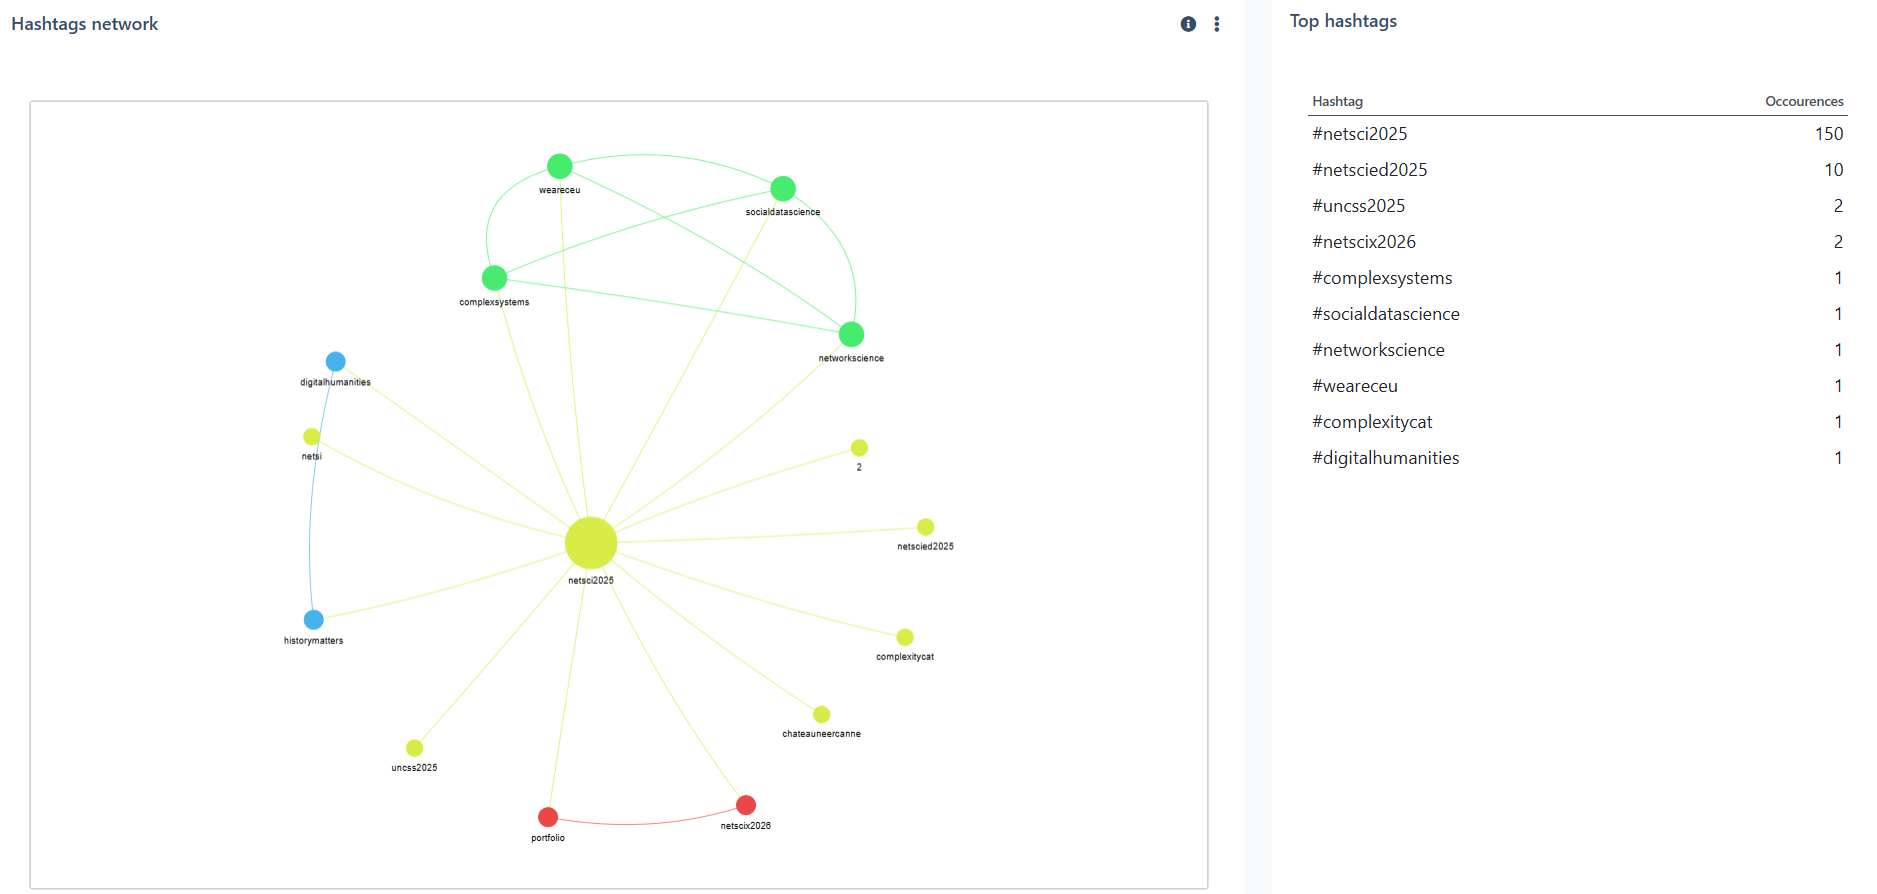
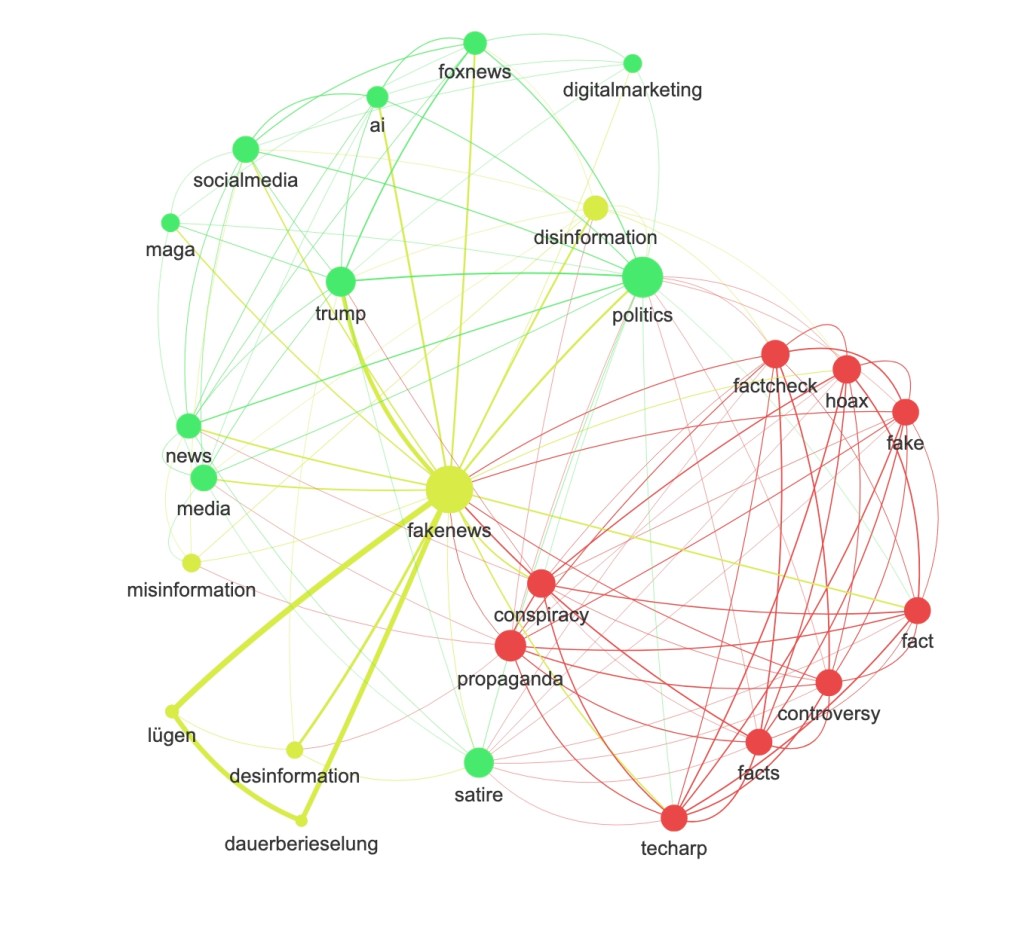
Hashtags network
The second network representation maps how hashtags appear together in the same posts. Is an undirected graph where:
- Nodes = individual hashtags
- Edges = co-occurrence frequency
- Visual patterns reveal thematic clusters and intersections between communities or narratives
- Each color highlights a different cluster of hashtags that frequently appear together
- Also available for download in GEXF and CSV
- Accompanied by a Top 10 hashtag ranking
This network is particularly useful for mapping how topics relate to each other and identifying emerging issue areas or coordinated campaigns.
Future roadmap
Nodiux is still in beta, and we’re actively working on new features:
- A lightweight dashboard for exporting custom reports
- Enrichment of post data with statistics like reposts, likes, and shares
- Additional network types: follower/following maps, reply chains, cross-posting
- Integration of data from other AT Protocol–based platforms, enabling comparative analysis across the ecosystem (e.g., Flashes or Spark)
Want to try?
Nodiux is ideal for:
- Social media researchers
- Journalists tracking online discourse
- Educators teaching digital sociology or communication
- Activists monitoring decentralized conversations
Explore or request access: www.nodiux.net.


Leave a comment