
In the vast realm of data visualization tools, Gephi stands out as a premier software for network analysis. But what exactly is Gephi, and why has it garnered such attention and acclaim in the data science community?
What is Gephi?
Gephi is an open-source software designed for visualizing and analyzing large networks graphs. It’s often likened to a “Photoshop” for networks, given its powerful rendering capabilities and the flexibility it offers users in terms of design and layout. But Gephi is more than just a visualization tool; it’s a comprehensive platform for network analysis, allowing users to explore the intricacies of complex systems, from social networks to organizational structures and beyond.
Why Gephi?
- Intuitive Interface: Gephi’s user-friendly interface makes it accessible to both beginners and experts. Its drag-and-drop functionality, coupled with a range of customizable settings, ensures a seamless user experience.
- Dynamic Analysis: Unlike static graphs, Gephi supports dynamic network analysis. This means you can visualize how networks evolve over time, capturing the emergence of new nodes, the dissolution of connections, and the shifting centrality of various elements.
- Modularity: Gephi is modular in design, allowing users to expand its capabilities through plugins. Whether you’re looking to integrate new algorithms, import different data formats, or enhance visualization options, there’s likely a plugin for it.
- Community Support: Being open-source, Gephi boasts a vibrant community of developers, researchers, and enthusiasts. This community-driven approach ensures continuous improvement, regular updates, and a wealth of resources for learning and troubleshooting.
- Scalability: Gephi can handle large datasets with ease. Its efficient algorithms and rendering engine ensure that even networks with thousands of nodes and edges are visualized smoothly.
Applications of Gephi
Gephi’s applications are as diverse as the networks it visualizes. Academics use it for research in fields like sociology, biology, and computer science. Journalists leverage it to map out intricate relationships in investigative stories. Digital marketers employ Gephi to understand online communities and influencers. In essence, anywhere there’s a network to be analyzed, Gephi can be a tool of choice.

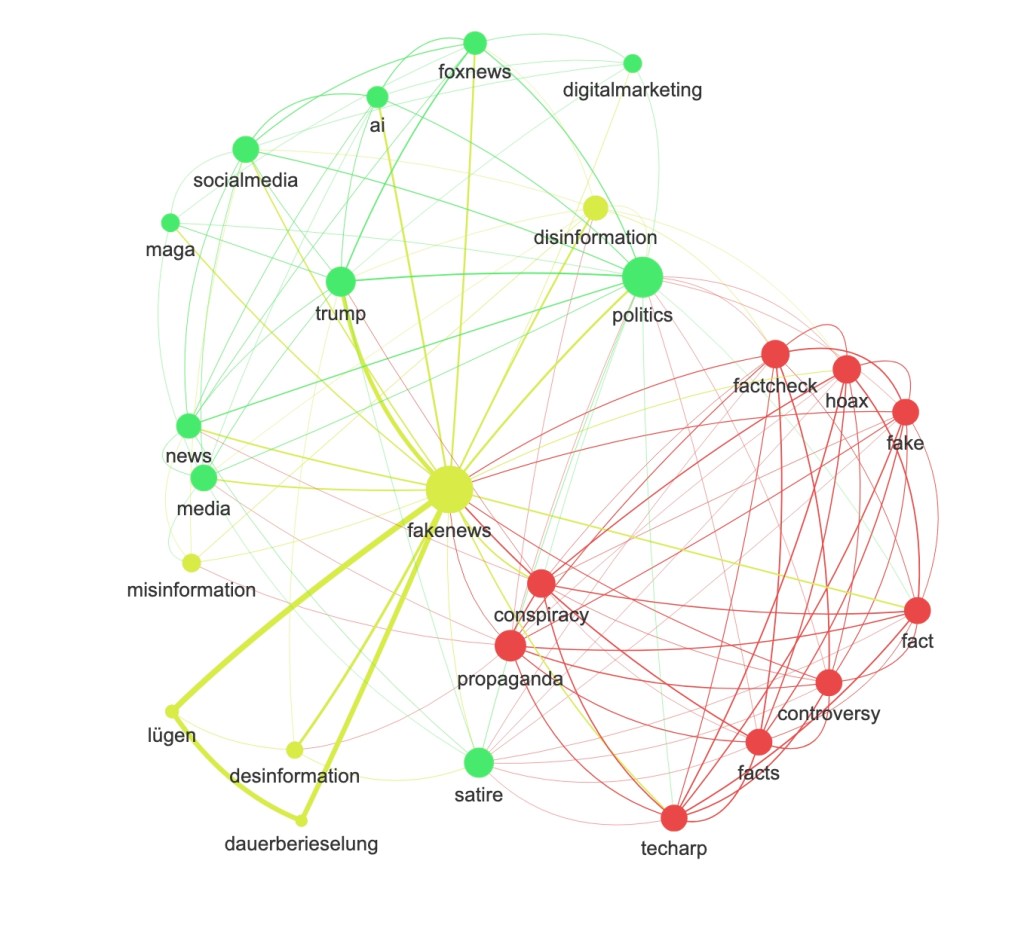
Semantic network: credits http://www.socioviz.net.
Quick Start with Gephi
Gephi’s Quick Start Guide provides a comprehensive introduction to the software. Here’s a brief overview:
- Import File: Begin by importing your dataset. Gephi supports various graph formats, ensuring compatibility with most data sources.
- Visualization: Once your data is imported, you can start visualizing your network.
- Layout: Adjust the layout to make your network more readable and visually appealing.
- Ranking (color): Color-code your nodes based on specific metrics or attributes.
- Metrics: Analyze your network’s metrics to gain insights into its structure and characteristics.
- Ranking (size): Adjust the size of your nodes based on specific metrics or attributes.
- Layout Again: Refine your layout after making adjustments to node colors and sizes.
- Show Labels: Display labels for nodes and/or edges to provide more information.
- Community Detection: Identify and highlight communities within your network.
- Partition: Segment your network based on specific attributes or metrics.
- Filter: Filter out specific nodes or edges to focus on particular parts of your network.
- Preview: Preview your network to see how it will look when exported.
- Export: Export your network visualization in various formats.
- Save: Save your project for future reference or editing.
For a detailed step-by-step guide, you can download the tutorial in PDF format.
Mastering Layouts in Gephi
Layouts play a crucial role in network visualization. They determine how nodes and edges are positioned, which in turn affects the readability and interpretability of the network. Gephi offers a wide range of layout algorithms, each designed to emphasize different features of the network. Let’s delve into the world of layouts in Gephi.
Introduction to Layouts
Gephi’s Layout Tutorial provides a comprehensive guide on how to use various layouts. Here’s a summarized overview:
- Run & Choice: Start by selecting the layout algorithm that best suits your data and the features you want to emphasize.
- ForceAtlas: A popular layout that uses a force-directed algorithm, ideal for most general-purpose networks.
- Fruchterman-Reingold: Another force-directed layout that distributes nodes in a way that minimizes edge crossings.
- YifanHu Multilevel: A multilevel layout that’s particularly useful for large networks.
- OpenOrd: A layout that emphasizes community structures within the network.
- ForceAtlas 2: An improved version of ForceAtlas, offering faster performance and better scalability.
- Circular Layout: Positions nodes in a circle, useful for emphasizing cyclic structures.
- Radial Axis Layout: Organizes nodes radially based on a chosen attribute.
- Geographic Map: If your nodes have geographical attributes, this layout positions them based on their real-world locations.
- Node Overlapping: Techniques to avoid nodes from overlapping each other, ensuring a clearer visualization.
- Geometric Transform: Apply geometric transformations to your network, such as scaling or rotating.
For a more detailed walkthrough, you can download the tutorial in PDF format.
Conclusion
Choosing the right layout is essential for effective network visualization. It can highlight important features, reveal hidden patterns, and make your network more interpretable. Spend time experimenting with different layouts to find the one that best tells the story of your data.
Join the Webinar
Join Me on This Journey: Don’t miss the upcoming webinar – Mastering Gephi for Network Analysis and Visualization. Register today and embark on a transformative journey with me. Together, let’s chart the future of social media analytics.


Leave a comment